How to analyze NSEI?
New update New NSEI analysis
What is NSEI?
NSEI is the symbol of the National Stock Exchange of India. we can plot stocks.
The National Stock Exchange of India (NSEI) is India's leading stock exchange.
getSymbols("^NSEI", from="2004-01-01", to=Sys.Date())
[1] "^NSEI"
> chartSeries(Cl(^NSEI))
> chartSeries(Cl(NSEI))
> ret1 <- dailyReturn(Cl(NSEI), type='log')
> par(mfrow=c(2,2))
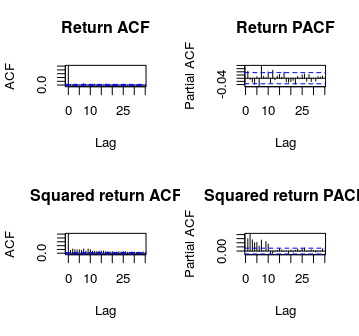
> acf(ret1, main="Return ACF");
> pacf(ret1, main="Return PACF");
> acf(ret1^2, main="Squared return ACF");
> pacf(ret1^2, main="Squared return PACF")
> par(mfrow=c(1,1))
> m=mean(ret1);s=sd(ret1);
> par(mfrow=c(1,2))
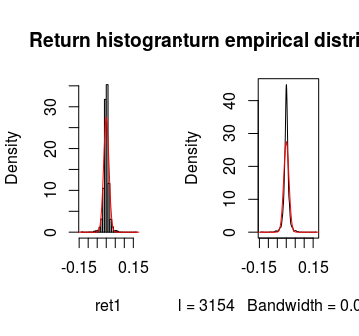
> hist(ret1, nclass=40, freq=FALSE, main='Return histogram');curve(dnorm(x,mean=m,sd=s), from = -0.3, to = 0.2, add=TRUE, col="red")
> plot(density(ret1), main='Return empirical distribution');curve(dnorm(x,mean=m,sd=s), from = -0.3, to = 0.2, add=TRUE, col="red")
> par(mfrow=c(1,1))
> kurtosis(ret1)
daily.returns
Daily return NSEI      16.72019
> plot(density(ret1), main='Return EDF - upper tail', xlim = c(0.1, 0.2),ylim=c(0,2));
> curve(dnorm(x, mean=m,sd=s), from = -0.3, to = 0.2, add=TRUE, col="red")
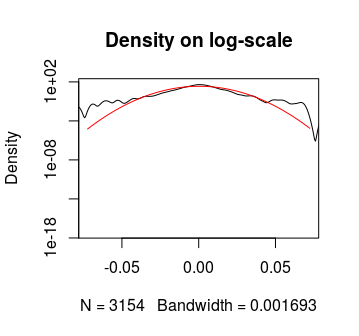
> plot(density(ret1), xlim=c(-5*s,5*s),log='y', main='Density on log-scale')

> curve(dnorm(x, mean=m,sd=s), from=-5*s, to=5*s, log="y", add=TRUE,col="red")
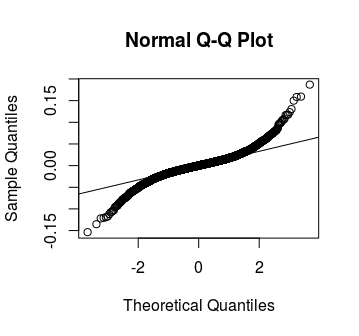
> qqnorm(ret);qqline(ret);
> chartSeries(ret1)
> garch11.spec = ugarchspec(variance.model = list(model="sGARCH",garchOrder=c(1,1)), mean.model = list(armaOrder=c(0,0)))
> aapl.garch11.fit = ugarchfit(spec=garch11.spec, data=ret1)
> nsei.garch11.fit = ugarchfit(spec=garch11.spec, data=ret1)
> coef(nsei.garch11.fit)
          mu        omega       alpha1
7.162159e-04 1.511431e-06 9.719140e-02
       beta1
8.980645e-01
Co varience in NSEI
> vcov(nsei.garch11.fit) [,1] [,2] [,3] [1,] 2.853286e-08 2.282690e-11 3.746905e-07 [2,] 2.282690e-11 1.474203e-12 1.604714e-08 [3,] 3.746905e-07 1.604714e-08 2.671834e-04 [4,] -3.647685e-07 -1.660605e-08 -2.513096e-04 [,4] [1,] -3.647685e-07 [2,] -1.660605e-08 [3,] -2.513096e-04 [4,] 2.461915e-04 > uncvariance(nsei.garch11.fit) [1] 0.0003185922 > uncmean(nsei.garch11.fit) [1] 0.0007162159 > infocriteria(nsei.garch11.fit) Akaike -6.128187 Bayes -6.120506 Shibata -6.128190 Hannan-Quinn -6.125431


0 Comments