How to analyze data( NIFTY50)
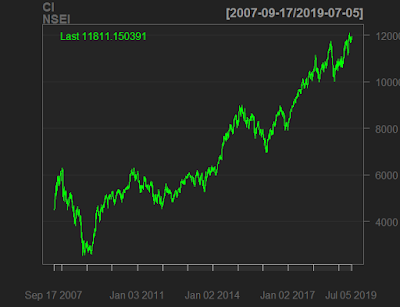
chartSeries(Cl(NSEI))
> ret <- dailyReturn(Cl(NSEI), type='log')
Warning message:
In to_period(xx, period = on.opts[[period]], ...) :
missing values removed from data
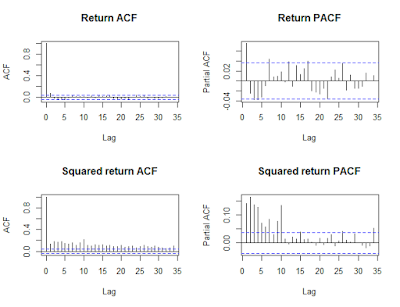
> par(mfrow=c(2,2))
> acf(ret, main="Return ACF");
> pacf(ret, main="Return PACF");
> acf(ret^2, main="Squared return ACF");
> pacf(ret^2, main="Squared return PACF")
> par(mfrow=c(1,1))
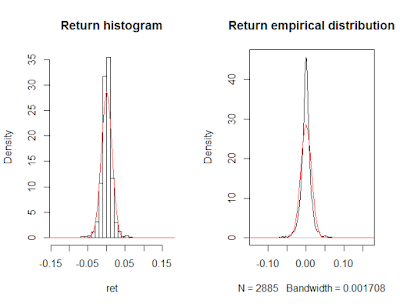
> m=mean(ret);s=sd(ret);
> par(mfrow=c(1,2))
> hist(ret, nclass=40, freq=FALSE, main='Return histogram');curve(dnorm(x,
+ mean=m,sd=s), from = -0.3, to = 0.2, add=TRUE, col="red")
> plot(density(ret), main='Return empirical distribution');curve(dnorm(x,
+ mean=m,sd=s), from = -0.3, to = 0.2, add=TRUE, col="red")
> par(mfrow=c(1,1))
> kurtosis(ret)
[1] 12.6355
attr(,"method")
[1] "excess"
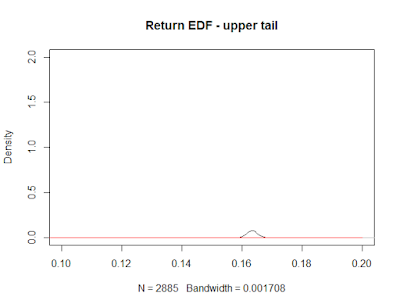
> plot(density(ret), main='Return EDF - upper tail', xlim = c(0.1, 0.2),
+ ylim=c(0,2));
> curve(dnorm(x, mean=m,sd=s), from = -0.3, to = 0.2, add=TRUE, col="red")
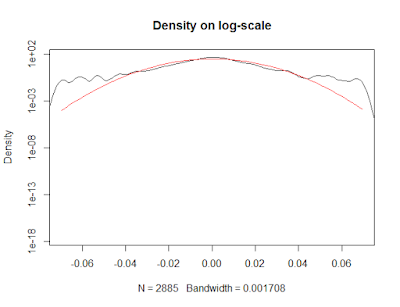
> plot(density(ret), xlim=c(-5*s,5*s),log='y', main='Density on log-scale')
Warning message:
In xy.coords(x, y, xlabel, ylabel, log) :
75 y values <= 0 omitted from logarithmic plot
> curve(dnorm(x, mean=m,sd=s), from=-5*s, to=5*s, log="y", add=TRUE,
+ col="red")
> qqnorm(ret);qqline(ret);


47 Comments
Their readings are occasionally moved to basic yet increasingly secure databases which thus add to an information database the executives framework as more information nourishes into social and progressive databases. ExcelR Data Science Courses
ReplyDeleteNumerous individuals nowadays are picking on the web affirmation courses. Numerous web based learning applications give quality seminars on information science and furthermore give an authentication to it. ExcelR Data Science Courses
ReplyDeleteThanks for giving this sort of nice information to all of us and please keep us updated in future also. I want to share some information about the Data Structures And AlgorithmsFor best career in Data science And web development Join skillslash it is best online platform For learning Data science And web development Courses for more information go through website links down :
ReplyDeleteData science course in chennai
Data science course in Bangalore
Data science course in Pune
Great post! I really enjoyed your perspective. It’s clear you put a lot of thought into this. Looking forward to more of your insights!
ReplyDeleteData Science Courses in Chennai
You’ve done an incredible job of making this topic clear and actionable. I feel inspired and ready to put these ideas into practice.
ReplyDeleteData science courses in Noida
Analyzing time series data for NIFTY50 involves examining historical price movements to identify trends, seasonality, and patterns. By applying statistical methods and visualization techniques, investors can make informed decisions based on past performance and potential future movements. Utilizing tools like moving averages and ARIMA models can enhance the analysis.
ReplyDeleteData Science Courses in Kolkata
I am looking for and I love to post a comment that "The content of your post is awesome" Great work!
ReplyDeleteData science courses in Nashik
Thank you, Manibhushan, for this comprehensive guide on time series analysis for NIFTY50! Your step-by-step approach and practical use of R code, especially with functions like acf and pacf for autocorrelation, really demystify the process. The inclusion of density plots and the histogram provides a thorough understanding of the data's distribution and volatility patterns, which is incredibly helpful for both beginners and experienced analysts. Your detailed explanation of each visualization, from ACF plots to the empirical distribution function, makes this a highly informative resource. Looking forward to more insightful posts like this!
ReplyDeletehttps://iimskills.com/data-science-courses-in-delhi/
ReplyDeleteAnalyzing time series data for NIFTY50 is a crucial process for traders and investors looking to understand market trends and make informed decisions. The steps outlined here provide a solid foundation for this analysis using R. By utilizing functions like getSymbols to retrieve historical data and employing methods like autocorrelation and partial autocorrelation functions (ACF and PACF), one can effectively identify patterns and dependencies in the returns. The visualizations, such as histograms and density plots, are essential for assessing the distribution of returns, allowing traders to gauge volatility and potential market behavior. This approach not only aids in developing trading strategies but also enhances understanding of the underlying market dynamics. Data science courses in Gurgaon
very accurate and precise wrtting, thanks for sharing
ReplyDeleteData science courses in Hyderabad
very accurate and precise wrtting, thanks for sharing
ReplyDeleteData science courses in Hyderabad
Great article on time series analysis! The breakdown of key concepts like trend, seasonality, and noise really helps make this complex topic more approachable. I appreciate the clear explanations and examples, especially for someone just starting to learn about time series data. I’m definitely looking forward to reading more on this subject!
ReplyDeleteData science courses in Dubai
Really nice and interesting post. I was looking for this kind of information and enjoyed reading this one. Keep posting. Thanks for sharing.
ReplyDeleteData Science Courses in India
"Great article! If you're aiming to build a career in data science, the Data science courses in Brighton are a great way to gain the skills employers are looking for. Definitely worth checking out if you want to enter the data-driven world."
ReplyDelete"Great article! If you're aiming to build a career in data science, the Data science courses in Brighton are a great way to gain the skills employers are looking for. Definitely worth checking out if you want to enter the data-driven world."
ReplyDeleteGreat breakdown of how to analyze time series data for NIFTY50! The steps you’ve outlined, from calculating daily returns to visualizing the autocorrelation and distribution, are key for understanding the behavior of market data. Data science courses in Visakhapatnam
ReplyDeleteGreat workdone.
ReplyDeleteData science courses in Pune
This is a great guide for analyzing NIFTY50 time series data! The step-by-step process, including data visualization and statistical analysis like ACF, PACF, and kurtosis, offers a comprehensive approach for anyone interested in financial data analysis. It’s a valuable resource for traders and analysts looking to understand market trends and returns. Keep up the good work!
ReplyDeleteData science courses in Gujarat
To analyze time series data for NIFTY50, you can follow these steps:
ReplyDelete1. **Data Collection**: Get historical data for NIFTY50 from sources like Yahoo Finance or NSE India.
2. **Preprocessing**: Clean the data by handling missing values, outliers, or irrelevant information.
3. **Visualization**: Plot the data using line charts or candlestick charts to observe trends, volatility, and seasonality.
4. **Statistical Analysis**: Use methods like moving averages, correlation, and stationarity tests (e.g., Augmented Dickey-Fuller test).
5. **Modeling**: Implement models like ARIMA, GARCH, or LSTM (for deep learning) to forecast future values based on historical trends.
6. **Evaluation**: Use metrics like RMSE or MAPE to evaluate the accuracy of your model's predictions.
Data Science Courses in Pune
The article explains how to analyze time series data, specifically focusing on the NIFTY50 stock index. It covers steps like data retrieval, using tools such as R to calculate returns, visualize autocorrelations (ACF, PACF), and assess data distributions with histograms and density plots. The goal is to identify trends, seasonality, and other patterns for making informed financial decisions.
ReplyDeleteData science courses in the Netherlands
Fantastic breakdown of such a complex topic! Your explanation of time series analysis for NIFTY50 is not only insightful but also easy to follow for beginners like me.
ReplyDeleteData science Courses in Sydney
Great explanation of time series analysis! The step-by-step approach makes it easy to understand the key concepts and methods. Thanks for providing such useful insights for beginners!
ReplyDeleteData science Courses in Canada
I can’t get enough of your blog! Each post is a great balance of depth and readability
ReplyDeleteData science Courses in London
I truly like your style of blogging. I added it to my preferred's blog webpage list and will return soon… Data science Courses in Melbourne
ReplyDeleteTime series analysis can be quite complex, but this article breaks it down in a way that’s easy to follow. The tips on visualizing trends and seasonality are extremely helpful, especially for those working in forecasting or data-driven decision-making."
ReplyDeleteData science courses in Glasgow
Your detailed guide on time series analysis is a fantastic resource for students and professionals alike.
ReplyDeleteData science courses in France
This is an excellent article with valuable information. Thank you for sharing such insightful content. I truly appreciate the effort you put into this post and look forward to reading more from you. I recently came across your blog and have thoroughly enjoyed exploring your posts. I’ll definitely be subscribing to your feed and hope to see more updates from you soon!
ReplyDeleteGST Course
Great work! Your passion for the topic really comes through.
ReplyDeletetechnical writing course
Great work! Your passion for the topic really comes through.
ReplyDeletetechnical writing course
ReplyDeleteAnalyzing time series data like NIFTY50 offers valuable insights into market trends and forecasting. By applying techniques such as moving averages, ARIMA models, and volatility analysis, investors can make informed decisions. Understanding the patterns in historical data is key to predicting future market movements effectively!
Data science Courses in City of Westminster
Neel KBH
kbhneel@gmail.com
This overview of time series analysis is highly informative and well-structured. It provides a clear understanding of key concepts and their applications, making it a great resource for learners. Thank you for sharing this excellent content!
ReplyDeleteData science courses in UAE
https://iimskills.com/data-science-courses-in-uae/
Fantastic tips! For more structured learning, I’d recommend exploring these digital marketing courses in Bangalore.
ReplyDeleteWell done on How to analyse time series data NIFTY50! I love how you made everything so easy to understand. The explanations were clear, and your examples really helped me grasp the topic. I’m looking forward to reading more of your work in the future!
ReplyDeleteOnline Data Analytics Courses
Your explanation of time series analysis is very insightful! The detailed examples make it much easier to understand this complex topic. Keep sharing such valuable content!
ReplyDeleteData Analytics Courses In Bangalore
Well-written piece! If you’re considering digital marketing training, don’t miss out on these digital marketing courses in Bangalore.
ReplyDelete"Analyzing NIFTY50 time series data can reveal valuable trends and insights, making it a crucial tool for traders and analysts."
ReplyDeleteDigital Marketing Courses in Delhi
digital marketing courses in delhi
Name: NEEL INTERN
Email ID: neelinterntask7@gmail.com
Very well explained. I would like to thank you for the efforts you had made for writing this awesome article. This article inspired me to read more. keep it up.
ReplyDeletedigital marketing courses in Bangalore with 100 placement
Your post on time series analysis is an excellent introduction to a complex topic. It’s well-structured and easy to follow, making it a great resource for students and professionals alike. Thanks for the great content!
ReplyDeletedigital marketing course in chennai fees
Your explanation of time series analysis is fantastic! It's a complex topic, but your step-by-step breakdown makes it much more approachable. This will definitely be helpful to anyone working with time-dependent data. Thanks for sharing your knowledge
ReplyDeleteTop 10 Digital marketing courses in pune
"Great post! I found the information you shared to be incredibly insightful and well-researched. Your explanation of the topic was clear and easy to understand, and I especially appreciated the practical tips you included. Looking forward to reading more of your content in the future!"
ReplyDeleteData Science Scope in India
I’m so glad I took the Digital Marketing Course in Dwarka. It provided me with all the skills I needed to excel in digital marketing.
ReplyDeleteReally nice and interesting post. I was looking for this kind of information and enjoyed reading this one. Keep posting. Thanks for sharing.
ReplyDeletetop 10 digital marketing agency in delhi
Very nice blog and articles. I am realy very happy to visit your blog. Now I am found which I actually want. I check your blog everyday and try to learn something from your blog. Thank you and waiting for your new post.
ReplyDeletedigital marketing course in varanasi
Great blog! Your clear explanations make complex topics easy to understand. Thank you for providing such valuable and insightful information!
ReplyDeletedigital marketing fresher salary in india
brango promo codes for existing players Stay ahead in the game with tailored for loyal players. Whether you’re a seasoned high-roller or a casual gamer, these codes unlock exciting bonuses such as extra free spins, reload offers, cashback rewards, and VIP-only promotions. Brango’s loyalty program ensures that returning players enjoy consistent perks—meaning the more you play, the bigger your benefits. From weekend boosts to surprise midweek rewards, these promo codes keep the fun rolling and your bankroll thriving. Claim yours regularly to maximize your winnings and make every session a winning experience.
ReplyDeleteWell-informed and composed content. I got such astounding data from the post. I will likewise say that the site plan is quite stacked rapidly overall. If you are looking for the same information about document verification, you can read it on the DIRO official website.
ReplyDelete