How to plot Mathematical formula with R
x <- seq(0,10,0.1)
> x
[1] 0.0 0.1 0.2 0.3 0.4 0.5 0.6
[8] 0.7 0.8 0.9 1.0 1.1 1.2 1.3
[15] 1.4 1.5 1.6 1.7 1.8 1.9 2.0
[22] 2.1 2.2 2.3 2.4 2.5 2.6 2.7
[29] 2.8 2.9 3.0 3.1 3.2 3.3 3.4
[36] 3.5 3.6 3.7 3.8 3.9 4.0 4.1
[43] 4.2 4.3 4.4 4.5 4.6 4.7 4.8
[50] 4.9 5.0 5.1 5.2 5.3 5.4 5.5
[57] 5.6 5.7 5.8 5.9 6.0 6.1 6.2
[64] 6.3 6.4 6.5 6.6 6.7 6.8 6.9
[71] 7.0 7.1 7.2 7.3 7.4 7.5 7.6
[78] 7.7 7.8 7.9 8.0 8.1 8.2 8.3
[85] 8.4 8.5 8.6 8.7 8.8 8.9 9.0
[92] 9.1 9.2 9.3 9.4 9.5 9.6 9.7
[99] 9.8 9.9 10.0
> windows(7,4)
> par(mfrow=c(1,2))
> y <- exp(x)
> plot(y~x,type="l",main="Exponential")
> y <- log(x)
> plot(y~x,type="l",main="Logarithmic")
> windows(7,7)
> par(mfrow=c(2,2))
> x <- seq(0,2*pi,2*pi/100)
> y1 <- cos(x)
> y2 <- sin(x)
> y3 <- tan(x)
> plot(y1~x,type="l",main="cosine")
> plot(y2~x,type="l",main="sine")
> plot(y3~x,type="l",ylim=c(-3,3),main="tangent")
> x <- seq(0,1,0.01)
> y <- xˆ0.5
Error: unexpected input in "y <- xˆ"
> y <- x^0.5
> plot(x,y,type="l",main="0<b<1")
> y <- x
> plot(x,y,type="l",main="b=1")
> y <- x^2
> plot(x,y,type="l",main="b>1")
> y <- 1/x
> plot(x,y,type="l",main="b<0")
> x <- seq(0,10,0.1)
> y1 <- 2+5*x-0.2*x^2
> y2 <- 2+5*x-0.4*x^2
> y3 <- 2+4*x-0.6*x^2+0.04*x^3
> y4 <- 2+4*x+2*x^2-0.6*x^3+0.04*x^4
> par(mfrow=c(2,2))
> plot(x,y1,type="l",ylab="y",main="decelerating")
> plot(x,y2,type="l",ylab="y",main="humped")
> plot(x,y3,type="l",ylab="y",main="inflection")
> plot(x,y4,type="l",ylab="y",main="local maximum")
> par(mfrow=c(2,2))
> y1 <- x/(2+5*x)
> y2 <- 1/(x-2+4/x)
> y3 <- 1/(xˆ2-2+4/x)
Error: unexpected input in "y3 <- 1/(xˆ"
> y3 <- 1/(x^2-2+4/x)
> plot(x,y1,type="l",ylab="y",main="Michaelis-Menten")
> plot(x,y2,type="l",ylab="y",main="shallow hump")
> plot(x,y3,type="l",ylab="y",main="steep hump")
> par(mfrow=c(1,1))
> t <- seq(0.2,4,0.01)
> plot(t,gamma(t),type="l")
> abline(h=1,lty=2)
> e0 <- 10
> n0 <- 10
plot
> plot(e0,n0,ylab="",xlab="",ylim=c(0,2*n0),xlim=c(0,2*e0),type="n")
> n <- 1000
> r <- 10
> for (i in 1:n) {
+ a <- point(r)
+ e <- e0+a[1]
+ n <- n0+a[2]
+ lines(c(e0,e),c(n0,n),col= "red")
+ }
Error in point(r) : could not find function "point"
> for (i in 1:n) {
+ a <- points(r)
+ e <- e0+a[1]
+ n <- n0+a[2]
+ lines(c(e0,e),c(n0,n),col= "red")
+ }
par(mfrow=c(2,2))
>
> hist(sample(1:6,replace=T,10000),breaks=0.5:6.5,main="",xlab="one die")
> a <- sample(1:6,replace=T,10000)
> b <- sample(1:6,replace=T,10000)
> hist(a+b,breaks=1.5:12.5,main="", xlab="two dice")
> c <- sample(1:6,replace=T,10000)
> hist(a+b+c,breaks=2.5:18.5,main="", xlab="three dice")
> d <- sample(1:6,replace=T,10000)
> e <- sample(1:6,replace=T,10000)
> hist(a+b+c+d+e,breaks=4.5:30.5,main="", xlab="five dice")
> mean(a+b+c+d+e)
[1] 17.4211
> sd(a+b+c+d+e)
[1] 3.819428
> lines(seq(1,30,0.1),dnorm(seq(1,30,0.1),17.5937,3.837668)*10000)
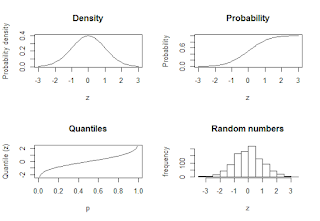
> par(mfrow=c(2,2))
> curve(dnorm,-3,3,xlab="z",ylab="Probability density",main="Density")
> curve(pnorm,-3,3,xlab="z",ylab="Probability",main="Probability")
> curve(qnorm,0,1,xlab="p",ylab="Quantile (z)",main="Quantiles")
> y <- rnorm(1000)
>
> hist(y,xlab="z",ylab="frequency",main="Random numbers")
> yvals <- rnorm(100,24,4)
> mean(yvals)
[1] 24.20079
> sd(yvals)
[1] 4.485446
> ydevs <- rnorm(100,0,1)
> ydevs <- (ydevs-mean(ydevs))/sd(ydevs)
> mean(ydevs)
[1] 1.832519e-17
> sd(ydevs)
[1] 1
> yvals <- 24 + ydevs*4
> mean(yvals)
[1] 24
> sd(yvals)
[1] 4
par(mfrow=c(1,1))
> t <- seq(0.2,4,0.01)
> plot(t,gamma(t),type="l")
> abline(h=1,lty=2)
> par(mfrow=c(2,2))
> x <- seq(0,10,0.1)
> y <- 100/(1+90*exp(-1*x))
> plot(x,y,type="l",main="three-parameter logistic")
> y <- 20+100/(1+exp(0.8*(3-x)))
> plot(x,y,ylim=c(0,140),type="l",main="four-parameter logistic")
> x <- -200:100
> y <- 100*exp(-exp(0.02*x))
> plot(x,y,type="l",main="negative Gompertz")
> x <- 0:100
> y <- 50*exp(-5*exp(-0.08*x))
> plot(x,y,type="l",main="positive Gompertz")
> par(mfrow=c(1,1))
> x <- 0:6
> plot(x,factorial(x),type="s",main="factorial x",log="y")
> choose(8,3)
[1] 56
> plot(0:8,choose(8,0:8),type="s",main="binomial coefficients")
> curve(pnorm(x),-3,3)
> arrows(-1,0,-1,pnorm(-1),col="red")
> arrows(-1,pnorm(-1),-3,pnorm(-1),col="green")
> pnorm(-1)
[1] 0.1586553
> curve(dnorm(x),-3,3)
> pnorm(-1.25)
[1] 0.1056498
> pnorm(1.875)
[1] 0.9696036
> 1-pnorm(1.875)
[1] 0.03039636
>
>
> pnorm(1.25)-pnorm(-0.625)
[1] 0.6283647


0 Comments