What is CAPM?
CAPM means capital asset pricing model and it is a financial model. It describes the relationship between expected return and risk of security.
We will start with a very popular, one-factor model (The Capital Asset Pricing Model or CAPM). The CAPM assumes the existence of one risk-free asset in which every agent can invest any amount that earns the risk-free rate. When stock returns are normally distributed, the price of a single stock can be elegantly expressed in relation to a broad market index, the relationship is generally expressed by a measure for a comovement of a single stock with the market index called beta.
CAPM is represented by the following equation:
Here,

denotes the expected return on asset i,

is the risk-free rate

is the beta coefficient

is expected to return on the market.
Beta can be interpreted as the level of the asset return's sensitivity as compared to the market in general.
Some possible examples:
If Beta <=-1, the asset moves in the opposite direction as the benchmark and in a greater amount than the negative of the benchmark.
If -1<Beta <0, the asset moves in the opposite direction to the benchmark.
If Beta =0, there is no correlation between the asset's price movement and the market benchmark.
If 0<Beta<1, the asset moves in the same direction as the market but the amount is smaller.
If Beta=1, the asset, and the market are moving in the same direction by the same amount.
If Beta >1, the asset moves in the same direction as the market, but the amount is greater.

Reliance beta stock price changes day by day.
Check the current beta price from here
CAPM is also called the One Factor Model.
How to apply CAPM and help investment with Python?
Import libraries :
import panda as pd
import yfinance as yf
import statsmodels.api as sm
First specified the assets(Reliance and Nifty50)
We wanted to use and time frame
Python code:
RISKY_ASSET = 'RELIANCE.NS'
MARKET_BENCHMARK = '^NSEI'
START_DATE = '2018-08-01'
END_DATE = '2021-09-16'
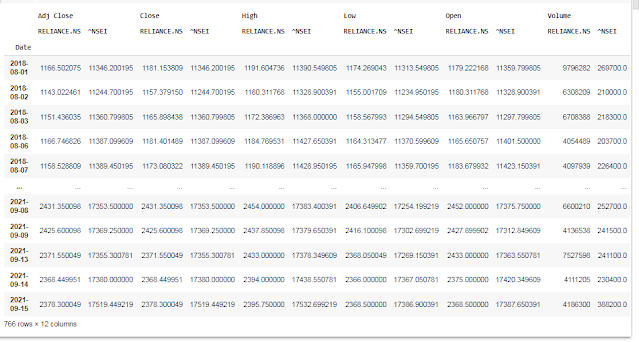
Data from Yahoo Finance
df = yf.download([RISKY_ASSET, MARKET_BENCHMARK],
start=START_DATE,
end=END_DATE,
adjusted=True,
progress=False)
Convert data daily into monthly
X = df['Adj Close'].rename(columns={RISKY_ASSET: 'asset',
MARKET_BENCHMARK: 'market'}) \
.resample('M') \
.last() \
.pct_change() \
.dropna()
Calculate Beta using covariance
covariance = X.cov().iloc[0,1]
benchmark_variance = X.market.var()
beta = covariance / benchmark_variance
The result of code beta =1.0546919715802414
These results indicate that the beta (denoted as nifty50)
is equal to 1.05.., which means Reliance's returns are 5 % more
volatile than the market. The value of the intercept is relatively
small and statistically insignificant at the 5% significance level.
Estimate CAPM as linear regression code in Python
y = X.pop('asset')
X = sm.add_constant(X)
capm_model = sm.OLS(y, X).fit()
capm_model = sm.OLS(y, X).fit()
print(capm_model.summary())
The results of estimating the CAPM model.
OLS Regression Results
==============================================================================
Dep. Variable: asset R-squared: 0.470
Model: OLS Adj. R-squared: 0.455
Method: Least Squares F-statistic: 31.00
Date: Fri, 17 Sep 2021 Prob (F-statistic): 2.87e-06
Time: 13:18:11 Log-Likelihood: 45.743
No. Observations: 37 AIC: -87.49
Df Residuals: 35 BIC: -84.26
Df Model: 1
Covariance Type: nonrobust
==============================================================================
coef std err t P>|t| [0.025 0.975]
------------------------------------------------------------------------------
const 0.0089 0.012 0.737 0.466 -0.016 0.034
market 1.0547 0.189 5.568 0.000 0.670 1.439
==============================================================================
Omnibus: 0.982 Durbin-Watson: 1.583
Prob(Omnibus): 0.612 Jarque-Bera (JB): 0.394
Skew: -0.234 Prob(JB): 0.821
Kurtosis: 3.193 Cond. No. 15.9
==============================================================================
We separated the target(Reliance's stock returns) and the
features(Nifty50 returns) using a pop method of a panda's
data frame. we added the constant to the features with
the add_constant function. The idea behind adding the intercept
to the regression is to investigate whether after estimating the
model intercept is zero. If it is positive and significant
it means that assuming the CAPM model is true, the asset or portfolio
generates an abnormally high-risk adjusted return. There are two
possible implications either the market is inefficient
or there are some other undiscovered risk factors that should
be included in the model. This issue is known as the hypothesis problem.
we get OLS regression, and we could see that the coefficient
by the market variable is the CAPM beta is equal to the beta
that was calculated using the covariance between the asset and
the market.
Other Examples
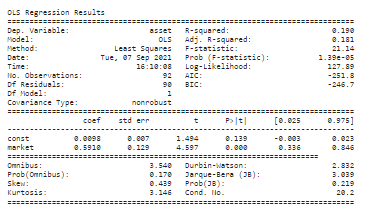
There are so many ways to get a forecast stock price. I am going to separate the target (TCS.NS's stock returns) and the features (NSEIreturns) using the pop method of a pandas DataFrame. Afterward, we added the constant to the features (effectively adding a column of ones) with the add_constant function.
The idea behind adding the intercept to this regression is to investigate whether—after
estimating the model—the intercept (in the case of the CAPM, also known as Jensen's
alpha) is zero. If it is positive and significant, it means that– assuming the CAPM model is true—the asset or portfolio generates abnormally high risk-adjusted returns. There are two possible implications—either the market is inefficient or there are some other undiscovered risk factors that should be included in the model. This issue is known as the joint hypothesis problem.
The beta of TCS is 0.591020194859077
How do you write CAPM code in Python?
There are a number of ways to write capm code in Python. I have described all processes with links.
To detailed analysis data on TCS and nsei click the link


0 Comments